| |
STEP WISE ASSISTANCE TUTORIAL
DATA INPUT
The ENTER button on the Home Page leads to the Main User input Page as seen below.
[Data entry area can also be accessed directly by clicking 'Your Web' section in the menu bar on top of every page.]
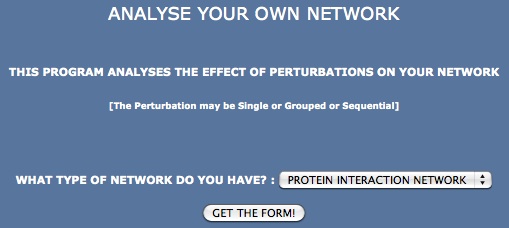
As seen above, users can select the dataset type or the system of interest.
NEXCADE enables analysis of different kinds of undirected and unweighted datasets such as protein- protein interaction data, co-expression data, bipartite ecological webs of interactions between organisms, and social network data. As an example, here we have selected 'protein-protein interactions'.
Clicking the 'Get Form' button after data selection leads to the 'Data Entry Form' Page, as shown below.
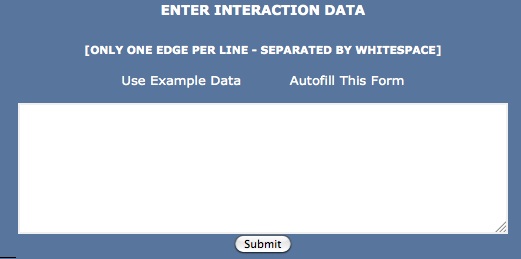 NEXCADE requires the interaction data of the graph to be submitted in a 2-column format. It is a simple text file with one 'edge' or 'interaction' per line. An edge is defined by two symbolic vertex names separated by whitespace. (The symbolic vertex names themselves cannot contain whitespace.)
If you have a large file, simply cut and paste the data in this form.
Here is an example of a small graph with four interactions between four 'nodes' or 'genes' or 'species' :
Node1 Node2
Node1 Node3
Node1 Node4
Node2 Node4
For more examples, see the 'Example' and 'Autofill' links on the Submission Page. By clicking 'Autofill', the form will get automatically loaded with data as shown below.
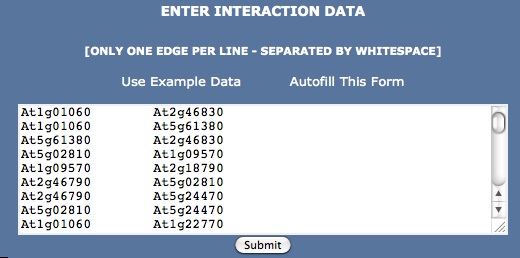 Click the 'Submit' button in order to begin NEXCADE scan of your data.
If there is any problem with the input data format, it will be returned at this stage. If the data format is alright, the scan will run run the start scripts and this may take some time depending upon data size.
Once the scan is complete, the main output window or RESULTS window will appear, as shown below.
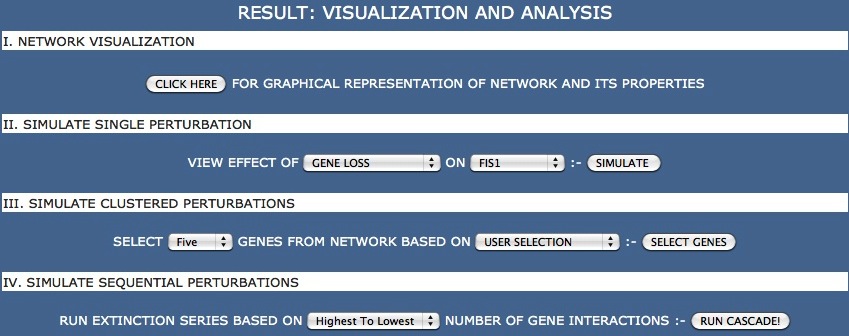
As can be seen above, the output of the NEXCADE scan results into four major sections for analysis of a given network, namely:
(I) Visualization and Attributes (II) Simulation of Single Perturbations (III) Simulation of Grouped Perturbations and (IV) Simulation of Serial or Cascading Perturbations,
each of which enables users to carry out desired simulations and impact analysis.
For more details and a step wise tutorial through any of these sections, click the respective links below.
Visualization and Attributes Simulation of Single Perturbations Simulation of Grouped PerturbationsSimulation of Sequential Perturbations
|
|
 Home
About
Tutorial
Your Web
Browse Webs
Contact
Download
Home
About
Tutorial
Your Web
Browse Webs
Contact
Download