logo Home       About      Tutorial      Your Web      Browse Webs      Contact      Download       
 
       TUTORIAL : VISUALIZATION AND ATTRIBUTES
 

STEP WISE ASSISTANCE TUTORIAL

DATA ANALYSIS: SECTION I: NETWORK VISUALIZATION

  • The first section of the Main Results Window shown below, allows users to visualize the input network of interest and its various graph based properties. [The format of this page is the same for both 'Your Web' and 'Browse Webs' sections of NEXCADE.]


    Main results Window

  • As seen above, the first section allows users to view a network representation of the system of interest.
  • On clicking the first button, the following page is returned.

    Data Visualization

  • This is the visualization output for the Arabidopsis thaliana genetic interaction newtork.

  • As seen above, the LEFT side of the output is a network representation of the dataset, while
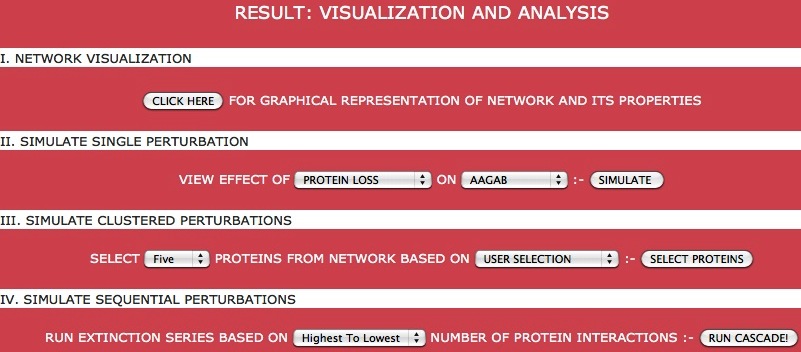
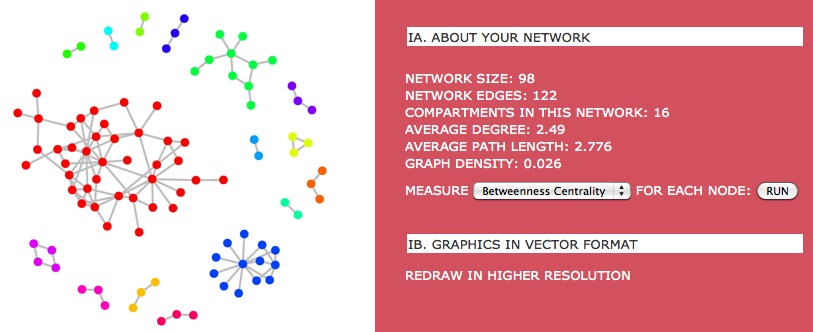
    The RIGHT side is a summary of the graph based properties of the network as a whole.

  • LEFT SIDE: In this image, network nodes are represented as circles connected by lines (relationships or edges) to other nodes.
    It is a very simple to read image allowing users to see whether the network is connected or not. Each node is colored by the connected component it belongs to. Thus, each individual color represents a disconnected fragment of the network.
    As can be seen above, the Arabidopsis thaliana genetic interaction network has 16 independent compartments.

  • RIGHT SIDE: This area of the output provides a summary of the graph based properties of the network as a whole.
  • This section also allows users to download high resolution images of the network for other purposes, if required.
    Network level properties include the number of nodes, edges and compartments in the network, along with its average degree, density and path-length.
    As can be seen above, the Arabidopsis thaliana genetic interaction newtork has 98 nodes and 122 edges.
  • For each of the 98 nodes in the network, users can visualise various node level graph properties by clicking the 'Run' button for the selected graph property. A definition of the attribute is provided on the output of this page.
  • Users can also choose to view all node properties together, as shown below. This enables convenient data download.

    Node Attribute Visualization

  • Result of Node Attribute visualization for each node in the network depicted above.


  • This completes the first section of network visualization and analysis.
    For the second section on 'Single Perturbations', click here.


    Back


    National Institute of Plant Genome Research