|
(A) SIMULATION OF RANDOM SINGLE PERTURBATIONS perturbations on the network in terms of destruction of random nodes. 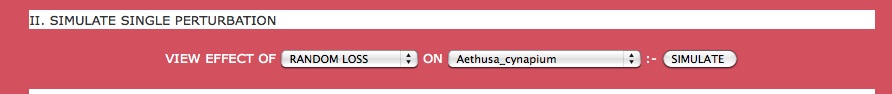
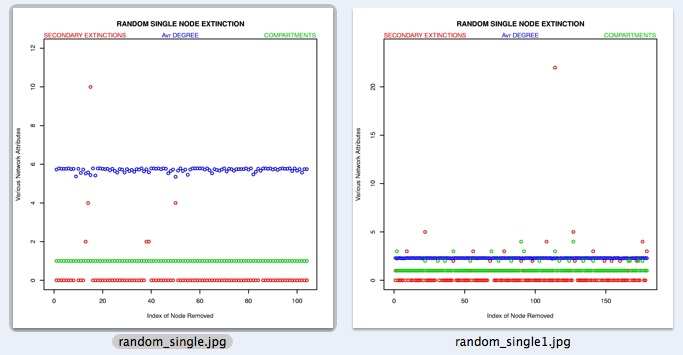
As shown above, the program enables monitoring the status of network at each random perturbation. A total of N independent random nodes are removed [N- network size], one at a time, and users can download the result of each iteration. As shown below, NEXCADE will co-plot all major network attributes for each single random deletion. 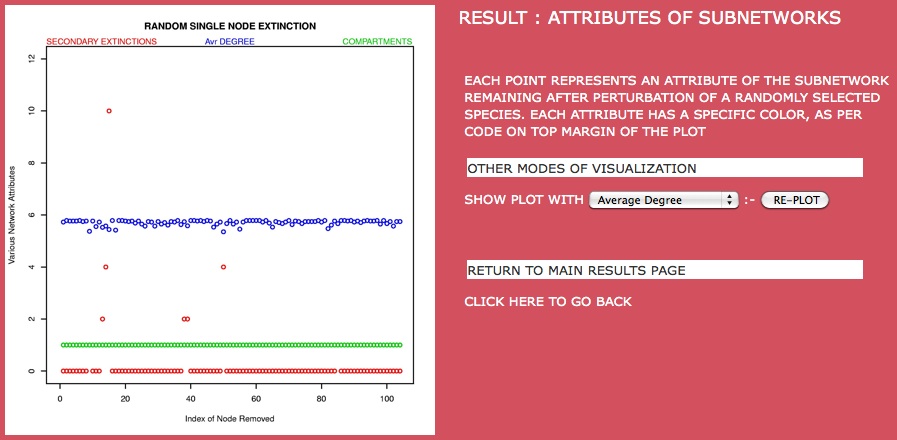
In this plot, Network degree (blue), clusters (green) and associated extinctions (red) can be visualized together for every node perturbed. NEXCADE allows users to plot the affect upon individual network properties in response to random perturbations, as shown below: 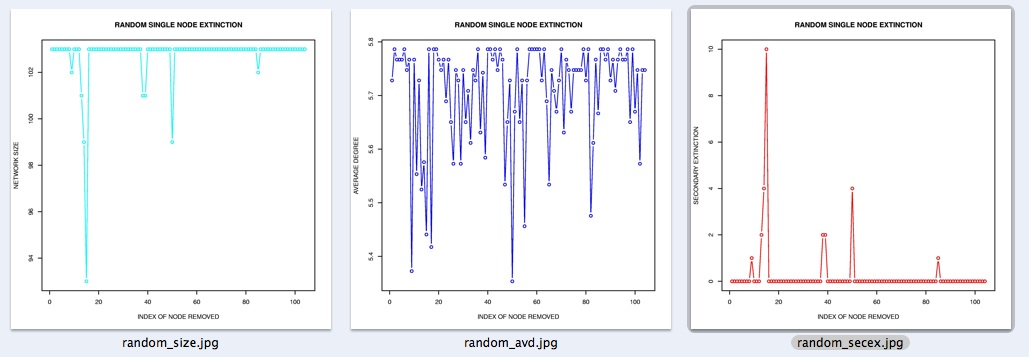
(B) SIMULATION OF RANDOM SEQUENTIAL CASCADES carry out random series of cascading perturbations on the network, and comparison of network response to the degree based ordered series described here. 
removal results in complete network collapse. Users can monitor the status of the initial network at each step of the perturbation, or get an overview of the change in critical network attributes during the perturbation, and finally download the raw data of the simulation for further analyses. For example, shown below is the affect on Total No. of Extinctions in case of degree ordered (green and red) cascades, as compared to the random (black) cascade. 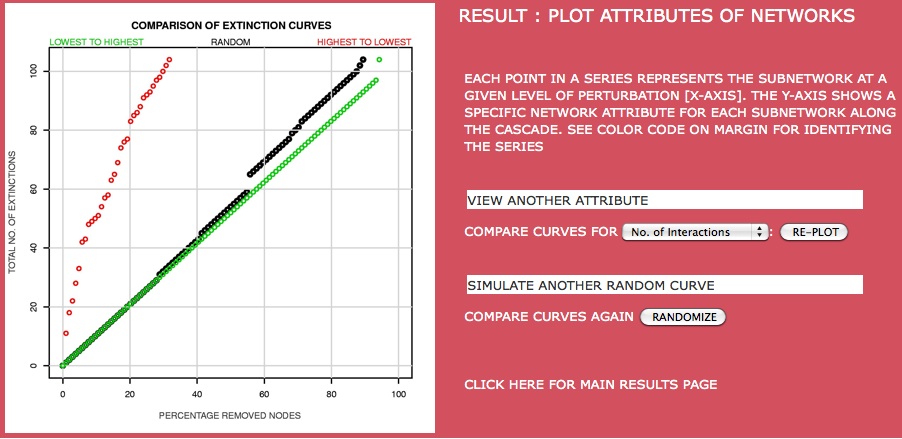
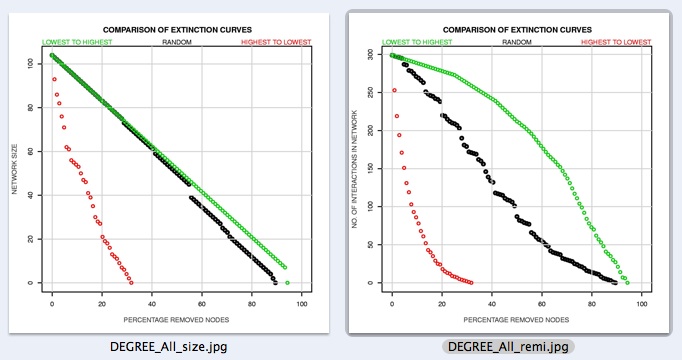
In case of the 'Highest To Lowest' perturbation sequence (shown in Red), the network collapses completely when only 20% nodes are perturbed. However, when nodes are removed in the opposing order ( shown in green), the network is able to tolerate the removal of almost 98% nodes without undergoing system collapse. Click here to return to the main tutoral page. |
 Home
About
Tutorial
Your Web
Browse Webs
Contact
Download
Home
About
Tutorial
Your Web
Browse Webs
Contact
Download
| TUTORIAL : RANDOM PERTURBATIONS | ||
|
|
Back
National Institute of Plant Genome Research